A collaborative remote sensing project between myself and Bryce Stouffer.
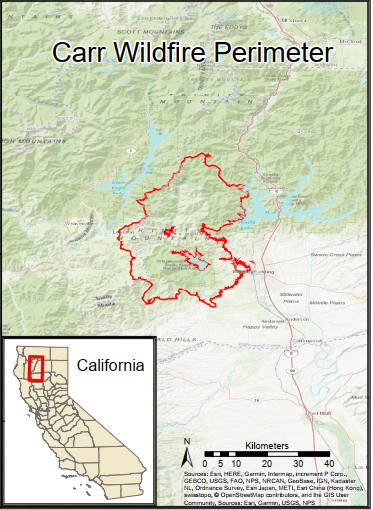
This project aimed to research the burn severity of the Carr Wildfire and its relationship to terrain slope steepness. The Carr Wildfire was located in Shasta and Trinity Counties in Northern California. It burned approximately 230,000 acres between July 23 and September 4, 2018. The Carr Fire cost billions of dollars in damages, destroyed 1,615 buildings, and caused three firefighter fatalities [1]. As of December 4, 2018, this was the seventh largest wildfire in California state history, in terms of acreage burned [1]. Given that wildfires are an increasing concern for Californians in the face of a warming climate, it is important to report on the severity of new fires as they appear and to study why some fires are more severe than others are. In a remote sensing lens, researching fire severity helps promote post-fire restoration efforts, helps stakeholders understand wildfire behavior, and may help predict future fires in the area.
Objective and Research Questions:
The objective of this research was to analyze the burn severity of the Carr Wildfire using satellite imagery and remote sensing/GIS techniques. Specifically, did areas of steep slope burn more severely than areas not of steep slope?
Data description and sources:
This project was performed using satellite imagery from the United States Geologic Survey (USGS) Earth Explorer website. The images contained less than 10% scene cloud cover. Also obtained was a digital elevation model (DEM) from the USGS Landfire Program website, as well as a Carr Fire perimeter polygon shapefile from the City of Redding.
| Satellite | Bands Used | Spatial Resolution | Aquisition Date | Corrections | WRS Path | WRS Row |
|---|---|---|---|---|---|---|
| Landsat 8 | NIR, SWIR2 | 30 meters | July 10, 2018 | Level 1 | 45 | 32 |
| Landsat 8 | NIR, SWIR2 | 30 meters | October 14, 2018 | Level 1 | 45 | 32 |
Table 1: Remotely sensed imagery
Methods:
Upon downloading the pre and post-fire satellite imagery from the USGS, the LANDSAT module was used to convert the images from a GeoTIFF format into a file format suitable for use in TerrSet. At the same time, an atmospheric correction was performed on the images using the Cos(t) method. This reduced the effect of atmospheric haze in the images and converted the digital number (DN) values to reflectance values. After this correction, the images were clipped to zone in on the study area and to decrease the effect of nearby cloud cover. To do this, the images were imported into ArcMap and a new feature class was created using the same projection as the satellite images (UTM, Zone 10N). From there, a rectangular polygon was drawn immediately surrounding the area of interest, which would become the clipping geometry. The clipped imagery was then converted back into a format TerrSet could read.
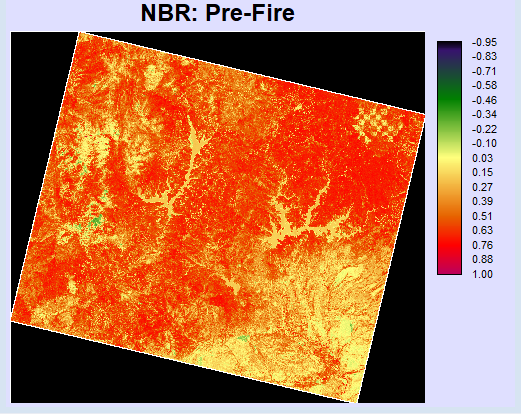 Figure 1
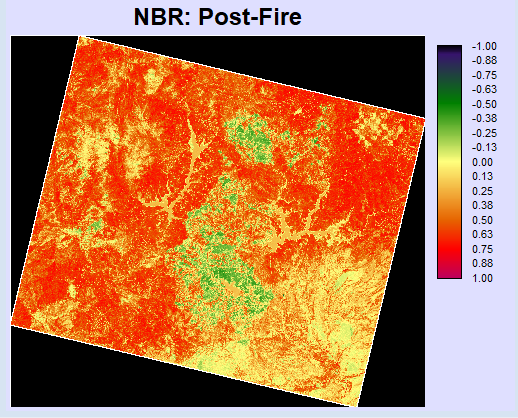 Figure 2
To create a burn severity index (dNBR or ΔNBR), the first step was to create normalized burn ratios (NBR) for the periods before and after the Carr Fire occurred (Figures 1 and 2). To do this, the near infrared and shortwave infrared bands were used for the July acquisition and subtracted them from each other. That output was then divided by the addition of those same two bands, which resulted in the pre-fire NBR. The post-fire NBR used the same methodology, with the exception of using the October image acquisitions instead.
To create the final burn severity index, the post-fire NBR was subtracted from the pre-fire NBR (Figure 3).
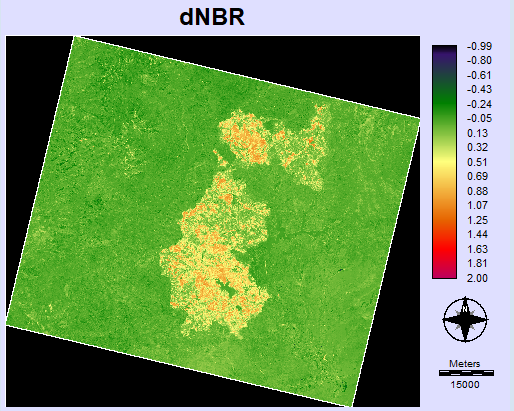
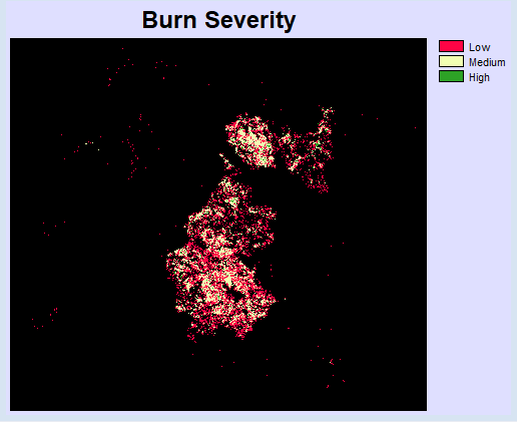
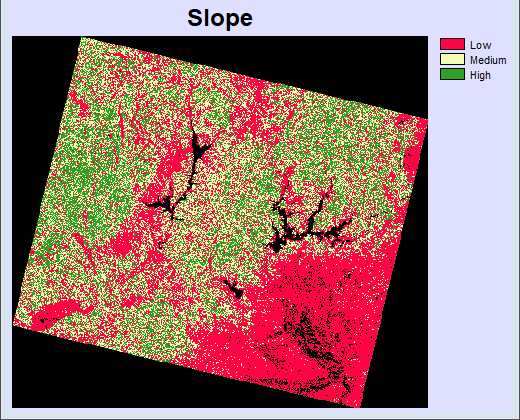
To analyze the relationship between fire severity and slope, the burn severity index image was reclassified into low, medium, and high severities, as well as areas not burned (see table 2). Then, a slope surface had to be created from the DEM obtained from Landfire. First, the DEM was clipped in ArcMap to the extent immediately surrounding the area of interest using the same feature class polygon that was created and used for the Landsat images. After converting the resulting GeoTiff to a format workable in TerrSet, the SURFACE module was used to calculate the DEM’s slope in degrees. The resulting slope image was then reclassified into low, medium, and high slopes, as well as areas with no slopes. Finally, a cross-tabulation was performed on the fire severity and slope classification images for direct comparison.
| Classification | Burn Severity |
|---|---|
| No burn | -1 - 0.35 |
| Low | 0.35 - 0.7 |
| Medium | 0.7 - 1 |
| High | 1 - 2 |
| Classification | Slope Severity |
|---|---|
| No slope | 0 - 0.1 |
| Low | 0.1 - 20 |
| Medium | 20 - 30 |
| High | 30 - 90 |
Results:
The results from the normalized burn ratio shows that the Carr Fire burned more severely from the central to the southeastern part of the fire. It also had severe burning along the central western perimeter to the northern western perimeter (Figure 4).
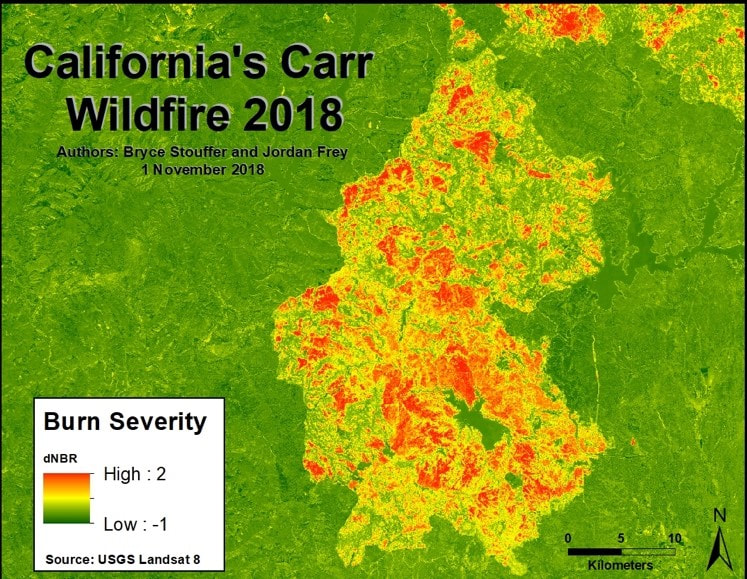 Figure 4
The results of the normalized burn ratio also reveal that there were two other fires within our study area occurring simultaneously with the Carr Fire. When the normalized burn ratio image is overlayed with a vector polygon of the Carr Fire (Figure 5), two fires can be distinguished above the Carr Fire (Figure 4). These two fires are the Delta and Hirz. The Delta Fire is directly above the Carr Fire and the Hirz Fire is above and to the right of the Carr Fire. It is more spread out. It appears the Delta Fire was the fire that burned the most severe.
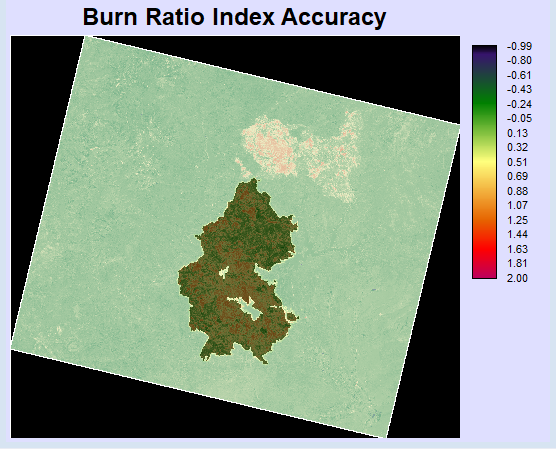 Figure 4
After classifying the burn severity of these fires into three levels of severity and after classifying the slope image into three levels of slope, the findings did not show that the higher severity of burned areas occurred at steeper slopes. Table 4 displays the proportional cross-tabulation results from the classified burn severity image (dNBR) and the classified slope image (Figure 6). From the total proportion of high burn severity in column 3, there was a greater proportion of high burn severity that occurred at low and medium steep slopes (rows 1 and 2) than there was of high burn severity that occurred at high steep slopes (row 3).
| No Fire | Low Fire | Medium Fire | High Fire | |
|---|---|---|---|---|
| No Slope | 0.3430 | 0.0001 | 0.0000 | 0.3432 |
| Low Slope | 0.2837 | 0.0134 | 0.0004 | 0.3047 |
| Medium Slope | 0.1837 | 0.0128 | 0.0002 | 0.2051 |
| High Slope | 0.1352 | 0.0076 | 0.0011 | 0.1470 |
| Total | 0.9456 | 0.0338 | 0.0011 | 1.0000 |
Conclusion and Discussion:
The Carr Fire perimeter shapefile was not available at the beginning of this project due to how recent the fire took place. If it was available, then the study area could have been clipped using that shapefile and the Delta and Hirz Fires would not have been able to affect the analysis. The discovery of the Delta and Hirz Fires highlights the importance of accuracy assessment and preliminary research of the study area and surrounding areas for any research project. Furthermore, honing in on the Carr Fire extent using that shapefile would most likely produced different results in regards to the cross-tabulation of burn severity and slope. A number of other confounding variables could possibly explain the reason the results did not show that the majority of severely burned areas occurred at the steepest slope, which was expected. A few of these variables could be the way the images were classified, the terrain of the study area did not contain many steep slopes, or the areas of steep slopes did not contain adequate fuel loadings for severe burns to take place. These variables would have been explored given more time, and they also would have been examined using the sole extent of the Carr Fire perimeter shapefile.
Additional Maps
References:
-
Cal Fire, ‘Carr Fire’, 2018. [Online] Available: http://www.fire.ca.gov/current_incidents/incidentdetails/Index/2164 [Accessed: 1- Dec- 2018]. ↩ ↩2